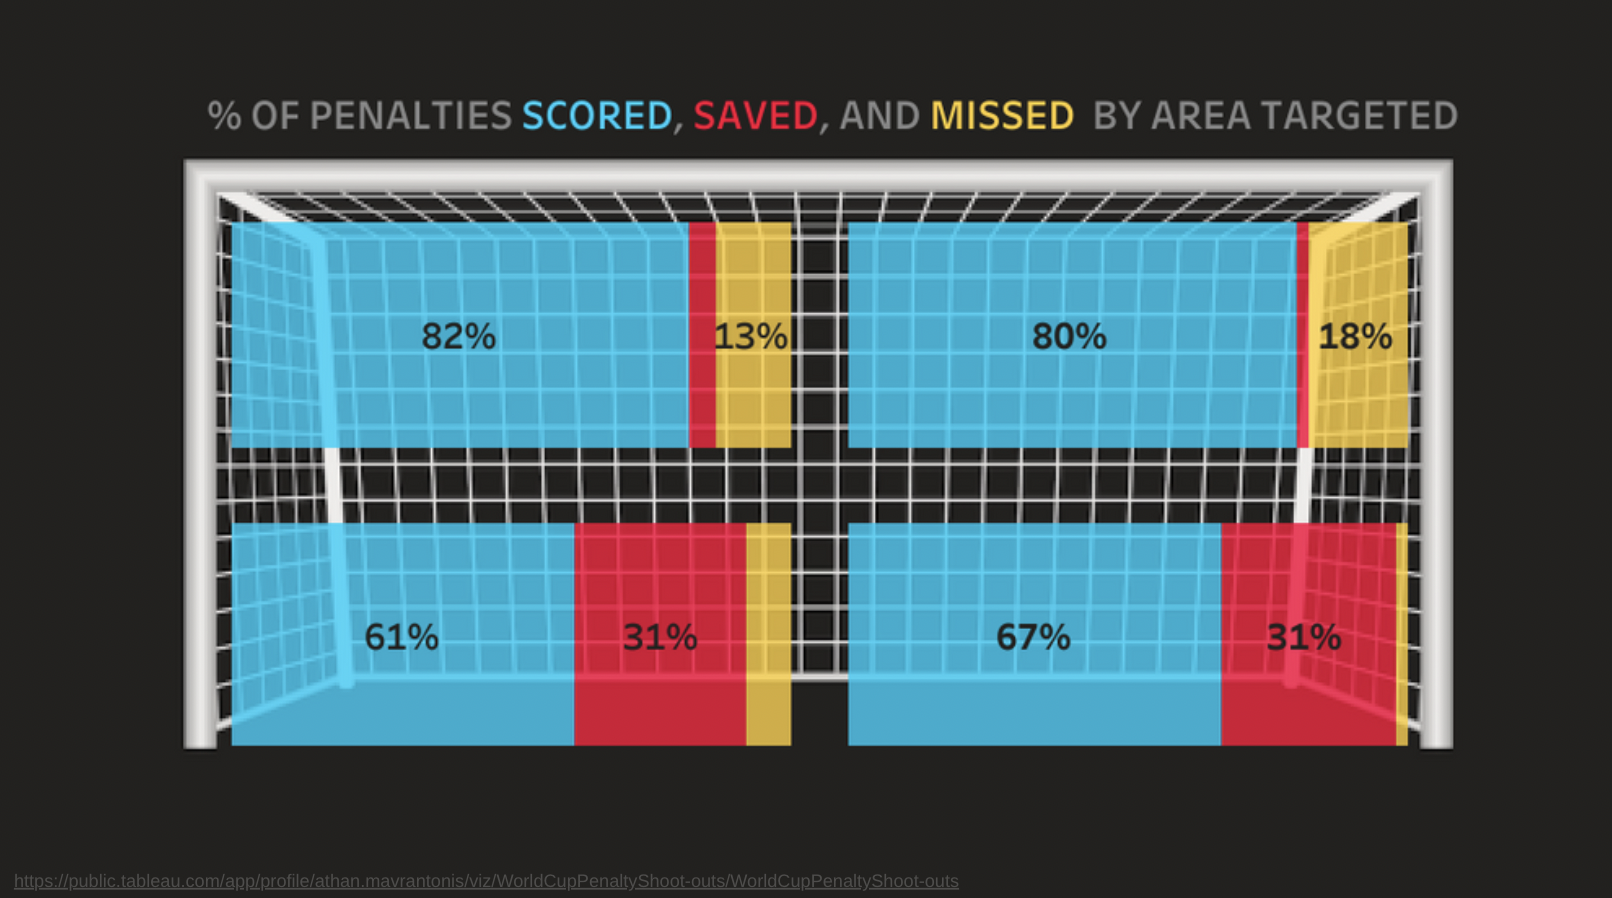
Sports Shot Data

By: Zeinab Drameh

The purpose of this page is to help people researching sports performance data gain insights into how shot location, distance, and positioning affect outcomes. By exploring these visualizations, users can learn to identify patterns, evaluate strategies, and apply knowledge to improve gameplay, coaching decisions, or general understanding of the sport.

TABLEU: World Cup Penalty Shootouts

This graphic is a data visualization of penalty kick outcomes in soccer (football), broken down by where in the goal the shot is aimed. The goal is divided into 4 zones; top right, top left, bottom left, bottom right. These zones are further divided into their percentages of outcomes. Blue displays the percentage of shots succesfully scored, red displays the percentage of shots saved by the goalie, and yellow displays the percentage of shots completely missed.

MAX WOOLF'S BLOG: Visualizing One Million NCAA Basketball Shots

This graph is a shot chart heatmap showing the success rate of over 1 million basketball shots from NCAA games. The court is mapped with colored squares where color intensity represents shooting accuracy in that spot. Yellow/green indicates high success rates, while blue/purple indicates lower success rates.

CONNOR MCLAUGHLIN: Using Ridgeline Plots to Visualize the NFL's Shift Towards Longer Field Goal Attempts

This graph shows how NFL field goal attempt distances have changed over the past 25 years, grouped into five-year spans. Earlier seasons (1999–2003) show more short attempts, while recent and projected seasons (2019–2028) show a clear increase in longer-distance field goal attempts. The vertical lines mark the 5th, 50th (median), and 95th percentiles, showing how the overall distribution has moved and is moving further out.

Information

Figure4 Goal Screenshot 1

Scoring Targets

One piece of information we can gain from these charts is which areas to aim for most reliable for scoring and defending. For example, from first visualization we can deduce that top corner have the highest chances of scoring, and bottom corners are easier for defending.
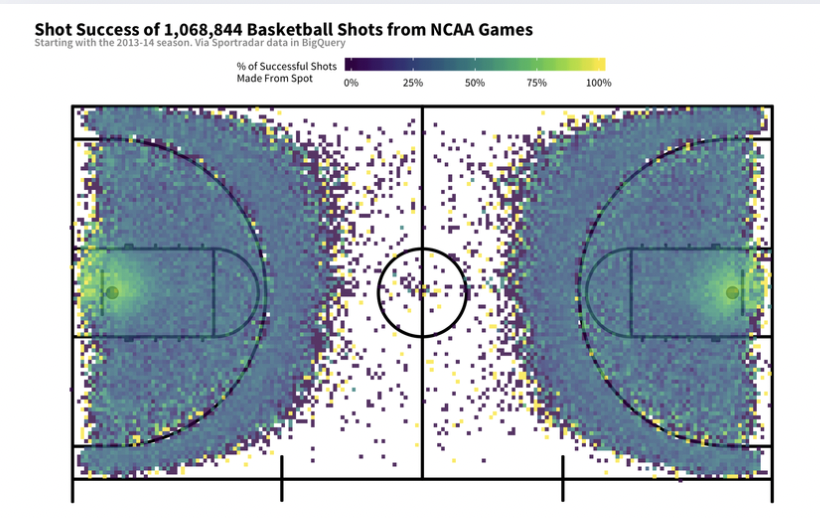
Figure5 Goal Screenshot 2

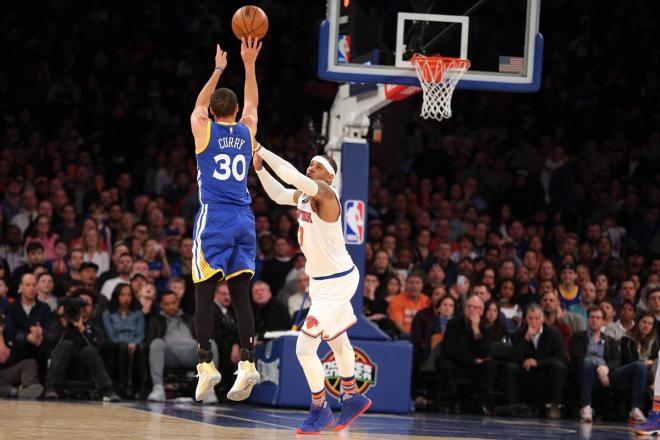
Scoring Types and Locations

From graphs like these, we can also learn where to shoot from to achieve greater accuracy. For example. In the second chart, we learn that highest shooting success comes from close to the basket, mid-range shots have lower accuracy, and 3-point shots unsurprisingly have the lowest. While this may seem obvious, the chart also helps us understand which specific areas in these categories have the highest accuracy. With close attention, we can see that shots made directly in front of the basket and in the pockets have better chances for mid-range to 3-point shots.
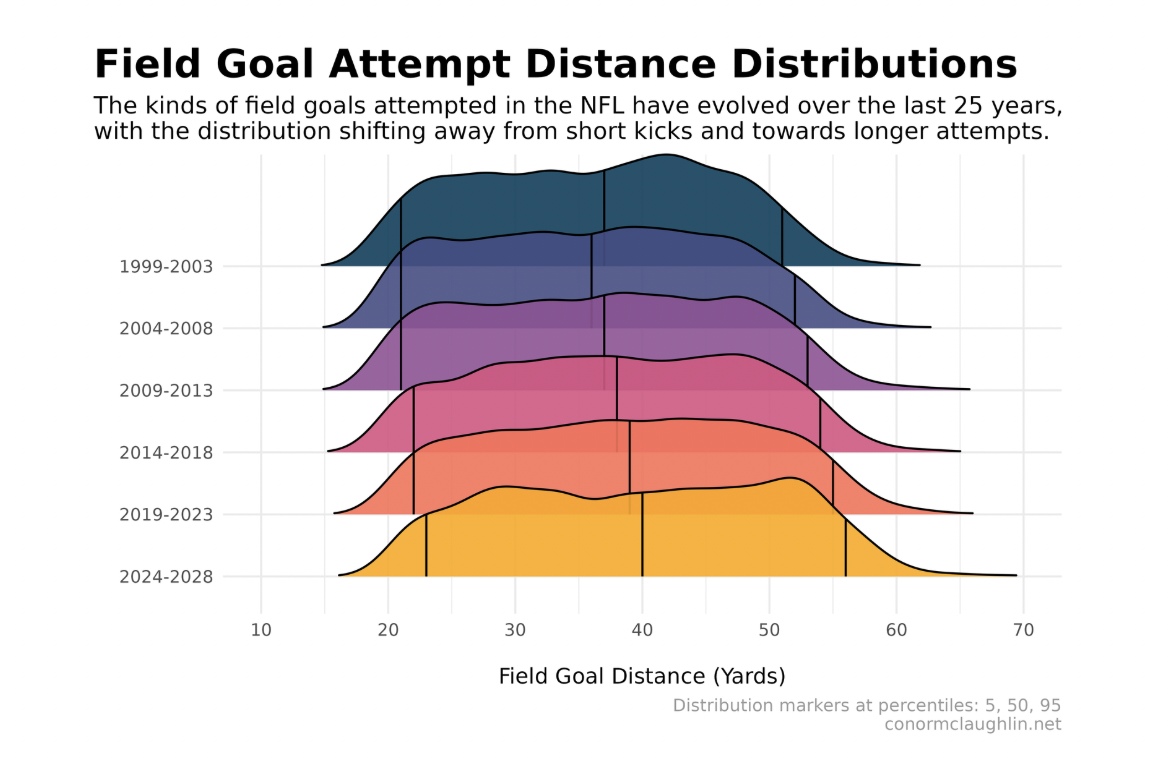
Figure6 Goal Screenshot 3

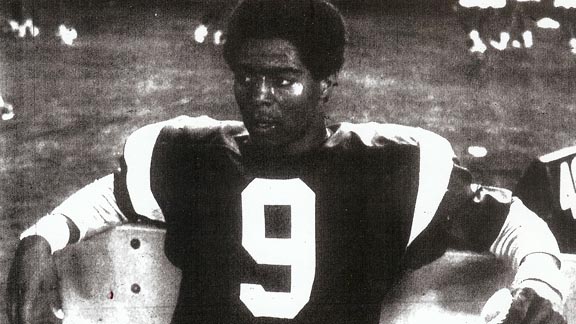
League Trends Over Time

From graphs like these, we can also learn how strategies change over time. For example, in the field goal visualization, we see that attempts have shifted from shorter distances toward longer kicks, helping us understand how the game has evolved and where performance expectations are changing.

Knowledge

Figure7 Insight Screenshot 1

Where to Aim

The visualization can give users key insights about aiming habits and their outcomes. Users can apply this insight to balance risk and reward, choosing aim based on skill, confidence,likelihood and strategies(defense vs offense etc.) that best complement their team.

Figure8 Insight Screenshot 2

Player Positioning

The data can help us learn which areas of the court produce the most efficient shots. We can use that knowledge to design offensive gameplans. For example, if the data shows higher success rates near the rim and from specific three-point zones, a coach can create rotations that place strong shooters in those “hot spots” while using screens and ball movement to keep defenders away.

Figure9 Insight Screenshot 3

Player Analysis

Based on the third visualization and league trends and standards over time, a coach might look at the shift toward longer kicks and analyze a specific kicker’s success rates at 40–50 yards compared to the league average. This helps determine whether the player is meeting modern standards or if additional training in leg strength and consistency from distance is required. These insights, and the ones mentioned before can also help teams make smart player drafts and well informed business decisions(like what kind of shooters/ kickers to draft for future success or even ticket pricing based on which seats provide clearer views of succesful shot locations) for leagues.